Food Chains
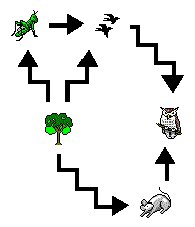
A food chain should be very simple, something you have been studying since primary school; but now we'll take it to the next level.A typical food chain chain looks like this:
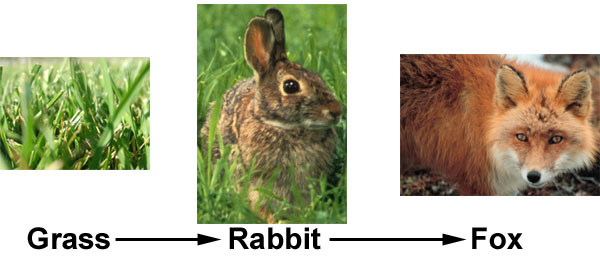
The energy comes as solar energy that plants use to convert into chemical energy (photosynthesis). The herbivores eat the plants, taking some of the energy and then they are prey and the energy is transfered to the predator.
But some of this energy is lost at each stage (or trophic level). In the above example, the grass looses some energy by respiration. And then the rabbit loses energy by heat and waste. And so by the time it gets to the fox a fraction of the original energy gets to it.
Energy Transfer
In an ecosystem there is energy, and this is what allows the organisms to live. This energy mainly comes from one original source: photosynthesis. The plants use this solar energy to produce carbohydrates which are then consumed by other organisms: transfering the energy.Not all of the energy from sunlight, however, is used by the plants; they are far from efficient. Much sunlight misses the plant, is in the wrong wavelength or lost in the inefficiencies of photosynthesis. We use the term gross primary production to refer to the total energy in the molecules of the plant; and net primary production is the surplus energy not used by the plant itself.
At each level of the food chain energy is lost because it is used by the organism itself for respiration. This limits the number of steps there can be on a food chain.
Ecological Pyramids
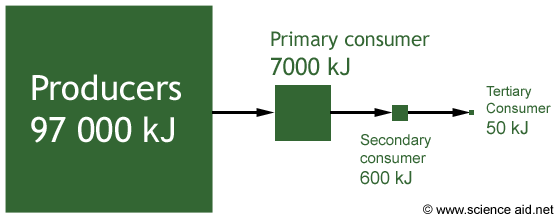
A food chain can be represented quantatively (with numbers) in the form of a pyramid of numbers, below is one for the previous food chain. From this graph we can see there are fewer foxes than rabbits; which makes sense because a fox must eat several rabbits to get enough energy in order to survive.An ecological pyramid shows the relative sizes of different components at the various trophic levels of a food chain. A trophic level refers to each stage (shown as a horizontal bar on ecological pyramids). There are three types of ecological pyramid we use: numbers, biomass and energy.

In the lower example, both the pyramid of numbers and biomass show a smaller producer bar; given what was discussed under the previous heading - this does not make sense. This is because the phytoplankton reproduce very quickly. However, when we represent this information in a pyramid of energy we get a true pyramid.
Plotting the energy will always give a true pyramid because it is impossible to create new energy so a trophic level will always be smaller than the one below it.